[under construction]
EARTH GRIDS:
PLANETARY METAPHYSICS
-
Curry Lines
-
Hartmann Net or Hartmann Lines
-
Ley Lines
-
Schumann Waves/Resonance
-
Black Lines
-
R. Buckminster
Fuller Dymaxion Map
-
Becker-Hagens Grid Map
(Unified Vector Geometry/UVG
120 Sphere; Earth Star)
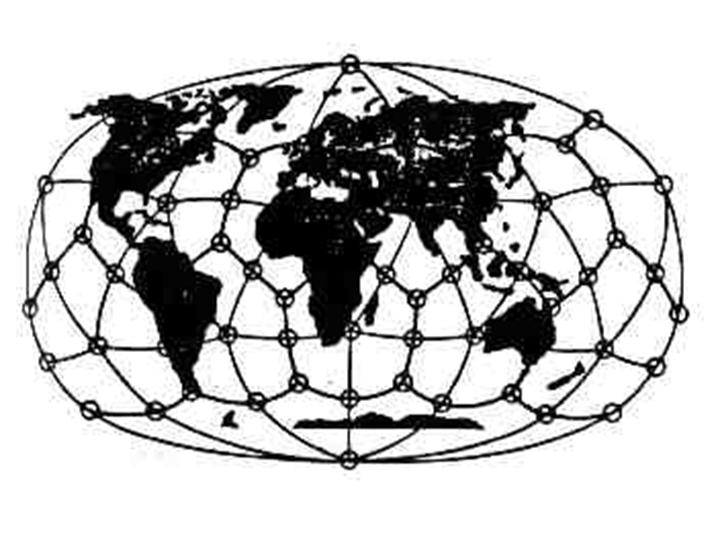
Becker-Hagens UVG 120 Sphere
electromagnetic Earth Grid.
INTRODUCTION
"The experience of life in a finite, limited body is specifically for the
purpose of discovering and manifesting supernatural (infinite)
existence within the
finite." -Pythagoras
Planetary 'energy' grid theory falls under
the heading of pseudoscience. It operates through geometrical patterns that
follow a specific symmetry linked to
sacred geometry.
The grids meet at various intersecting
points forming a grid or matrix. This is equivalent to the acupuncture points on
our bodies. These grid points can be found at some of the strongest power places
on the planet.
During the Renaissance, Leonardo daVinci initiated the perspective of the
individual observer in drawing and painting systems,
which positioned the observer at the center of the universe [sim.Taoist
precept].
"Our destiny is to encounter our embracing collective mind with increasing
intimacy and resonance. We awaken to a love life, in which personal love expands
to planetary love- through this touching new body of mindfulness. A new body of
mind crystallizes among us." -Dan Winter
THEORY
CURRY LINES
Earth radiation is a theoretical
geophysical phenomenon described primarily by the German authors Manfred Curry
and Ernst Hartmann.
They both describe a mystic force field
(similar to Odic force, Mana, Qi) that covers the earth at regular intervals and
can be detected by dowsing using a divining rod. It is not supposed to be
detectable by common scientific instruments but some still connect it to
telluric currents, which are actual phenomena, detectable by scientific
instruments.
Placing people or other living things in
certain spots of the earth radiation knots is believed to be beneficial/harmful
depending on radiation flow direction. It connects to the Gaia philosophy and
vitalist school and is very popular in certain New Age circles in Europe,
especially in Germany.
The radiation is described as a grid-like
arrangement with lines at regular distances:
-
Curry lines are supposed to be circa 3
meters apart (with variations), diagonally to the poles, east to west.
-
Hartmann lines run both east-west
and north-south forming a grid across the earth's surface with a distance of
circa 2 meters in the north-south direction and 2.5 meters in the east-west
direction.
-
Ley lines are man-made energy lines,
created by stone formations such as stone ships or other ancient
archaeological structures. The knowledge of creating ley lines is supposed
to be lost.
SCHUMANN WAVES/RESONANCE
Some
proponents of this theory will also mention
Schumann Waves/Resonance (which,
like telluric current, is an actual scientifically detectable phenomena) and
Black Lines.
The Schumann Resonance is a set of spectrum peaks in the ELF portion of the
Earth's electromagnetic field spectrum. Schumann resonance is due to the
space between the surface of the Earth and the conductive ionosphere acting
as a waveguide. The limited dimensions of the earth cause this waveguide to
act as a resonant cavity for electromagnetic waves in the ELF band. The
cavity is naturally excited by energy from lightning strikes. Since the
seventh overtone lies at approximately 60 Hz, the cavity is also driven by
the North American power grid.
The lowest-frequency (and
highest-intensity) mode of the Schumann resonance is at a frequency of
approximately
7.83 Hz.
Detectable overtones extend upwards into the kilohertz range. The phenomenon
is named after physicist Winfried Otto Schumann who predicted it
mathematically in 1952, but it was first observed by Nikola Tesla and formed
the basis for his scheme for broadcast power and wireless communications
(Tesla 1905).
The Schumann resonances (SR)
are a set of spectrum peaks in the
extremely low frequency (ELF) portion of the
Earth's
electromagnetic field spectrum. Schumann resonances are global
electromagnetic
resonances, excited by
lightning
discharges in the cavity formed by the
Earth surface
and the
ionosphere
Description
This global
electromagnetic
resonance phenomenon is named after physicist
Winfried Otto Schumann who predicted it mathematically
in 1952. Schumann resonance occurs because the space between
the surface of the
Earth and the conductive
ionosphere acts as a
waveguide. The limited dimensions of the
Earth cause this
waveguide to act as a
resonant cavity for
electromagnetic waves in the
ELF band. The cavity is naturally excited by energy from
lightning strikes. Schumann resonance modes are observed
in the power spectra of the natural electromagnetic
background noise, as separate peaks at extremely low
frequencies (ELF) around 7.8, 14.3, 20.8, 27.3 and 33.8 Hz.
The
fundamental mode of the Schumann resonance is a
standing wave in the Earth-ionosphere cavity with a
wavelength equal to the
circumference of the
Earth. This lowest-frequency (and highest-intensity)
mode of the Schumann
resonance occurs at a
frequency of approximately 7.8 Hz. Further resonance
modes appear at approximately 6.5 Hz intervals, a
characteristic attributed to the atmosphere's spherical
geometry. The peaks exhibit a spectral width of
approximately 20% on account of the damping of the
respective modes in the dissipative cavity. The eighth
overtone lies at approximately 59.9 Hz.
Schumann resonances
are used to track global
lightning activity. Owing to the connection between
lightning activity and the Earth's
climate they can also be used to monitor global
temperature variations and variations of upper water vapor.
Extraterrestrial lightning may also be detected and studied
with Schumann resonances. Schumann resonances have been used
for research and monitoring of the lower
ionosphere on
Earth and was suggested for exploration of lower
ionosphere parameters on
celestial bodies. Schumann resonances can be used to
track geomagnetic and ionospheric disturbances. More
recently, Schumann resonances have been used for monitoring
transient luminous events –
sprites,
elves,
jets, and other
upper-atmospheric lightning. A new field of interest
using Schumann resonances is related to short-term
earthquake prediction. Schumann resonances have gone
beyond the boundaries of
physics, invading
medicine, raising interest in artists and musicians, and
gaining interest from fringe fields such as
psychobiology.
[edit]
History
The first suggestion
that an
ionosphere existed, capable of trapping
electromagnetic waves, was made by
Heaviside and Kennelly in 1902
[1]
[2]. It took
another twenty years before
Edward Appleton and Barnett in 1925
[3], were able to
prove experimentally the existence of the
ionosphere. However, even prior to this, the first
documented observations of global electromagnetic resonances
were made by Nikola
Tesla in 1905 and formed the basis for his scheme for
wireless energy transmission
[4]. Although some of
the most important mathematical tools for dealing with
spherical
waveguides were developed by Watson in 1918
[5], it was
Winfried Otto Schumann who first studied the theoretical
aspects of the global
resonances of the earth-ionosphere
waveguide system, known today as the Schumann
resonances. In 1952-1954 Schumann, together with Köning,
attempted to measure the resonant frequencies
[6]
[7]
[8]
[9] . However,
it was not until measurements made by Balser and Wagner in
1960-1963
[10]
[11]
[12]
[13]
[14] that
adequate analysis techniques were available to extract the
resonance information from the background noise. Since
then there has been an increasing interest in Schumann
resonances in a wide variety of fields.
[edit]
Basic Theory
Lightning discharges
are considered as the primary natural source of Schumann
resonances. Lightning channels behave like a huge antenna
which radiates
electromagnetic energy as impulsive signals at
frequencies below about 100 kHz
[15]. These signals
are very weak, but the earth-ionosphere
waveguide behaves like a
resonator at ELF frequencies and amplifies the spectral
signals from
lightning at the
resonance frequencies
[15].
In an ideal cavity,
the
resonant frequency of the n-th
mode fn
is determined by the
Earth radius a and
the
speed of light c
[6].
-
The real
Earth-ionosphere
waveguide is not a perfect electromagnetic cavity.
Losses due to finite
ionosphere
electrical conductivity make the system resonate at
lower frequencies than would be expected in an ideal case,
and the observed peaks are wide. In addition there are a
number of horizontal asymmetries – day-night transition,
latitudinal changes in the
Earth magnetic field, sudden ionospheric disturbances,
polar cap absorption, etc. that complicate the Schumann
resonance power spectra.
[edit]
Measurements
Today Schumann
resonances are recorded by many stations around the world.
The electromagnetic sensors used to measure Schumann
resonances consist of two horizontal antennas for receiving
the
magnetic field in the north-south and the east-west
direction and one vertical antenna for observing the
vertical
electric field. Since Schumann resonance frequencies are
extremely low, practical antennas would have to be hundreds
of kilometers long. In addition, the Schumann resonance
electric field amplitude (~300 microVolts/m) is much smaller
than the static electric field (~150 V/m) in the
atmosphere. Similarly, the amplitude of the Schumann
resonance magnetic field (~1 picoTesla) is
orders of magnitude smaller than the
Earth magnetic field (~30-50 microTesla)
[16] .
Therefore, special receivers and antennas are needed to
measure Schumann resonances. The electric component is
commonly measured with a ball antenna, suggested by Ogawa et
al. in 1966
[17] , connected to a
high-impedance
amplifier. The
magnetic field is measured with magnetic
induction coils consisting of tens of thousands of turns
around material with very high
magnetic permeability.
[edit]
Applications
[edit]
Global lightning
activity
From the very
beginning of Schumann resonance studies, they were used to
monitor global
lightning activity by tracking changes in Schumann
resonance field intensities. At any given time there are
about 2000
thunderstorms around the
globe
[18]. Producing ~50
lightning events per
second
[19], these
thunderstorms create the background Schumann resonance
signal.
Determining the
spatial
lightning distribution from Schumann resonance records
is a complex problem: in order to properly estimate the
lightning intensity from Schumann resonance records it
is necessary to account for both the distance to
lightning sources as well as the wave propagation
between the source and the observer. The common approach is
to make a preliminary assumption on the spatial
lightning distribution, basing on the known properties
of
lightning
climatology. An alternative approach is placing the
receiver at the North or South Pole, which remain
approximately
equidistant from the main thunderstorm centers during
the day
[20]. One
method not requiring preliminary assumptions on the
lightning distribution
[21] is based on the
decomposition of the average background Schumann resonance
spectra, utilizing ratios between the average electric and
magnetic spectra and between their linear combinations.
[edit]
Diurnal variations
The best documented
and the most debated features of the Schumann resonance
phenomenon are the diurnal variations of the background
Schumann resonance power spectrum.
A characteristic
Schumann resonance diurnal record reflects the properties of
both global
lightning activity and the state of the earth-ionosphere
cavity between the source region and the observer. The
vertical
electric field, which is equally sensitive in all
directions and therefore measures the global
lightning, shows three dominant maxima, associated with
the three “hot spots” of planetary
lightning activity: 9 UT (Universal
Time) peak, linked to the increased
thunderstorm activity from south-east Asia; 14 UT peak
associated with the peak in African
lightning activity; and the 20 UT peak resulting for the
increase in
lightning activity in South America. The time and
amplitude of the peaks vary throughout the year,
reflecting the seasonal changes in
lightning activity.
[edit]
”Chimney” ranking
In general, the
African peak is the strongest, reflecting the major
contribution of the African “chimney” to the global
lightning activity. The ranking of the two other peaks –
Asian and American is the subject of a vigorous dispute
among Schumann resonance scientists. Experimental Schumann
resonance data show a greater contribution from Asia than
from South America. This contradicts optical satellite and
climatological
lightning data that show the South American thunderstorm
center stronger than the Asian center
[19]. The reason
for such disparity remains unclear. Williams and Sátori
[22]
suggest that in order to obtain “correct” Asia-America
chimney ranking, it is necessary to remove the influence of
the day/night variations in the ionospheric conductivity
(day-night asymmetry influence) from the Schumann resonance
records. On the other hand, such “corrected” records
presented in the work by Sátori et al.
[23] show that even
after the removal of the day-night asymmetry influence from
Schumann resonance records, the Asian contribution remains
greater than American. Similar results were obtained by
Pechony et al.
[24] who
calculated Schumann resonance fields from satellite
lightning data. Both simulations – those neglecting the
day-night asymmetry, and those taking this asymmetry into
account, showed same Asia-America chimney ranking. As for
today, the reason for the “invert” ranking of Asia and
America chimneys in Schumann resonance records remains
unclear and the subject requires further, targeted research.
[edit]
Influence of the
day-night asymmetry
In the early
literature the observed diurnal variations of Schumann
resonance power were explained by the variations in the
source-receiver (lightning-observer) geometry
[10]. It
was concluded that no particular systematic variations of
the
ionosphere (which serves as the upper
waveguide boundary) are needed to explain these
variations
[25]. Subsequent
theoretical studies supported the early estimations of the
small influence of the
ionosphere day-night asymmetry (difference between
day-side and night-side
ionosphere conductivity) on the observed variations in
Schumann resonance field intensities
[26].
The interest in the
influence of the day-night asymmetry in the
ionosphere conductivity on Schumann resonances gained a
new strength in the 1990s, after publication of a work by
Sentman and Fraser
[27].
Sentman and Fraser developed a technique to separate the
global and the local contributions to the observed field
power variations using records obtained
simultaneously at two stations. Sentman and Fraser
interpreted the local contribution as
ionosphere height variation. Their work convinced many
scientists in the importance of the ionospheric day-night
asymmetry and inspired numerous experimental studies.
However recently it was shown that results obtained by
Sentman and Fraser can be approximately simulated with a
uniform model (without taking into account
ionosphere day-night variation) and therefore cannot be
solely interpreted in terms of
ionosphere height variation
[28] .
Schumann resonance
amplitude records show significant diurnal and seasonal
variations which in general coincide in time with the times
of the day-night transition (the
terminator). This time-matching seems to support the
suggestion of a significant influence of the day-night
ionosphere asymmetry on Schumann resonance amplitudes.
There are records showing almost clock-like accuracy of the
diurnal amplitude changes
[23]. On the other
hand there are numerous days when Schumann Resonance
amplitudes do not increase at
sunrise or do not decrease at
sunset. There are studies showing that the general
behavior of Schumann resonance
amplitude records can be recreated from diurnal and
seasonal
thunderstorm migration, without invoking ionospheric
variations
[26]
[24]. Two
recent independent theoretical studies have shown that the
variations in Schumann resonance power related to the
day-night transition are much smaller than those associated
with the peaks of the global
lightning activity, and therefore the global
lightning activity plays a more important role in the
variation of the Schumann resonance power
[29]
[24].
It is generally
acknowledged that source-observer effects are the dominant
source of the observed diurnal variations, but there remains
considerable controversy about the degree to which day-night
signatures are present in the data. Successful monitoring of
global thunderstorm activity with Schumann resonances relies
on the proper interpretation of experimental data. It is
therefore vital to understand and correctly interpret the
major features of Schumann resonance field power variations.
[edit]
The “inverse
problem”
One of the
interesting problems in Schumann resonances studies is
determining the
lightning source characteristics (the “inverse
problem”). Temporally resolving each individual flash is
impossible,[clarify]
but there are intense ELF transient events, also named ‘‘Q
bursts’’. Q-bursts are triggered by intense
lightning strikes, associated with a large charge
transfer and often high peak current
[17]. Q-bursts can
exceed the
amplitude of the background signal level by a factor of
10 and appear with intervals of ~10sec
[21], which allows
to consider them as isolated events and determine the source
lightning location. The source location is determined
with either multi-station or single-station techniques. The
multi-station techniques are more accurate, but require more
complicated and expensive facilities.
[edit]
Transient luminous
events research
It is now believed
that many of the Schumann resonances transients (Q bursts)
are related to the transient luminous events (TLEs). In 1995
Boccippio et al.
[30] suggested
that sprites, the most common TLE, are produced by positive
cloud-to-ground
lightning occurring in the stratiform region of a
thunderstorm system, and are accompanied by Q-burst in
the Schumann resonances band. Recent observations
[30]
[31] reveal
that occurrences of sprites and Q bursts are highly
correlated and Schumann resonances data can possibly be used
to estimate the global occurrence rate of sprites
[32].
[edit]
Climate change
research
Global
climate change is the subject of intense debate and
concern. One of the important aspects in understanding
global climate change is the development of tools and
techniques that would allow continuous and long-term
monitoring of processes affecting the
global climate. Schumann resonances are one of the very
few tools that can provide such global information reliably
and cheaply.
[edit]
Global temperature
Williams [1992]
[33] suggested
that global temperature may be monitored with the Schumann
resonances. The link between Schumann resonance and
temperature is
lightning flash rate, which increases nonlinearly with
temperature
[33]. The
nonlinearity of the
lightning-to-temperature relation provides a natural
amplifier of the temperature changes and makes Schumann
resonance a sensitive “thermometer”. Moreover, the ice
particles that are believed to participate in the
electrification processes which result in a
lightning discharge
[34] have an
important role in the radiative feedback effects that
influence the atmosphere temperature. Schumann resonances
may therefore help us to understand these
feedback effects.
[edit]
Upper tropospheric
water vapor
Tropospheric
water vapor is a key element of the Earth’s climate,
which has direct effects as a
greenhouse gas, as well as indirect effect through
interaction with
clouds,
aerosols and tropospheric chemistry. Upper tropospheric
water vapor (UTWV) has a much greater impact on the
greenhouse effect than
water vapor in the lower
atmosphere
[35], but whether
this impact is a positive, or a negative
feedback is still uncertain
[36]. The main
challenge in addressing this question is the difficulty in
monitoring UTWV globally over long timescales. Continental
deep-convective
thunderstorms produce most of the
lightning discharges on
Earth. In addition, they transport large amount of
water vapor into the upper
troposphere, dominating the variations of global UTWV.
Price [2000]
[37] suggested
that changes in the UTWV can be derived from records of
Schumann Resonances.
[edit]
Extraterrestrial
lightning
Existence of
Schumann resonances is conditioned primarily by two factors:
1) presence of a substantial
ionosphere with electric conductivity increasing with
height from low values near the surface (or a
high-conductivity layer, in case of gaseous planets); 2)
source of excitation of
electromagnetic waves in the ELF range. In
Solar System there are five candidates for Schumann
resonance detection:
Venus,
Mars,
Jupiter,
Saturn and its moon
Titan.
Modeling Schumann
resonances on the
planets and
moons of the
Solar System is complicated by the lack of knowledge of
the
waveguide parameters, and today there is no possibility
to validate the results. Nevertheless, theoretical results
aid to estimate the possibility of detecting Schumann
resonances on a
planet.
The strongest
evidence for
lightning on
Venus comes from the impulsive
electromagnetic waves detected by
Venera 11 and 12 landers. Schumann resonances on
Venus were studied by Nickolaenko and Rabinowicz [1982]
[38] and
Pechony and Price [2004]
[39]. Both
studies yielded very close results, indicating that Schumann
resonances should be easily detectable on this
planet given a suitably located sensor.
On
Mars
lightning activity has not been detected, but charge
separation and
lightning strokes are considered possible in the Martian
dust storms
[40]
[41] . Martian global
resonances were modeled by Sukhorukov [1991]
[42], Pechony
and Price [2004]
[39] and
Molina-Cuberos et al. [2006]
[43] . The
results of the three studies are somewhat different, but it
seems that at least the first two Schumann resonance modes
should be detectable.
It was long ago
suggested that
lightning dischargers may occur on
Titan
[44] , but recent
data from
Cassini-Huygens seems to indicate that there is no
lightning activity on this largest
satellite of
Saturn. Due to the recent interest in
Titan, associated with the
Cassini-Huygens mission, its
ionosphere is perhaps the most thoroughly modeled today.
Schumann resonances on
Titan received more attention than on other
celestial bodies. Schumann resonances on
Titan were studied by Besser et al. [2002]
[45] , Morente et
al. [2003]
[46] , Molina-Cuberos
et al. [2004]
[47] ,
Nickolaenko et al. [2003]
[48] and
Pechony and Price [2004]
[39] . It
appears that only the first Schumann resonance mode might be
detectable on
Titan.
Jupiter
is the only planet where
lightning activity has been optically detected.
Existence of
lightning activity on this planet was predicted by
Bar-Nun [1975]
[49] and it is now
supported by data from
Galileo,
Voyagers 1 and 2,
Pioneers 10 and 11 and Cassini.
Saturn is also expected to have intensive
lightning activity, but the three visiting spacecrafts –
Pioneer 11 in 1979,
Voyager 1 in 1980 and
Voyager 2 in 1981, failed to provide any convincing
evidence from optical observations. The strong storm
monitored on
Saturn by the
Cassini spacecraft produced no visible
lightning flashes, although electromagnetic sensors
aboard the spacecraft detected signatures that are
characteristic of lightning. Little is known about the
electrical parameters of
Jupiter and
Saturn interior. Even the question of what should serve
as the lower
waveguide boundary is a non-trivial one in case of the
gaseous planets. There seem to be no works dedicated to
Schumann resonances on
Saturn. Up to date there has been only one attempt to
model Schumann resonances on
Jupiter
[50], where the
lower conducting boundary within the gaseous atmosphere was
modeled using a thermodynamic approach. Given the intense
lightning activity at Jupiter, the Schumann resonances
should be easily detectable with a sensor suitably located
within the planetary-ionospheric cavity.
[edit]
Popular culture
(wikipedia)
see also video:
http://www.forbiddenknowledgetv.com/videos/cancer/resonance-beings-of-frequency.html
LEY LINES
Ley lines refer to hypothetical alignments
of a number of places of geographical interest, such as ancient monuments and
megaliths. Their existence was suggested in 1921 by the amateur archaeologist
Alfred Watkins, whose book The Old Straight Track brought the alignments
to the attention of the wider public.
The existence of alignments between sites
is easily demonstrated. However, the causes of these alignments are disputed.
There are several major areas of interpretation:
-
Archaeological: A new area of
archaeological study, archaeogeodesy, examines geodesy as practiced in
prehistoric time, and as evidenced by archaeological remains. One major
aspect of modern geodesy is surveying. As interpreted by geodesy, the
so-called ley lines can be the product of ancient surveying, property
markings, or commonly traveled pathways. Numerous societies, ancient and
modern, employ straight lines between points of use; archaeologists have
documented these traditions. Modern surveying also results in placement of
constructs in lines on the landscape. It is reasonable to expect human
constructs and activity areas to reflect human use of lines.
-
Cultural:
Many cultures use
straight lines across the landscape. In South America, such lines often are
directed towards mountain peaks; the Nazca lines are a famous example of
lengthy lines made by ancient cultures. Straight lines connect ancient
pyramids in Mexico; today, modern roads built on the ancient roads deviate
around the massive pyramids. The Chaco culture of Northeastern New Mexico
cut stairs into sandstone cliffs to facilitate keeping roads straight.
-
New Age:
Some writers widely
regarded as pseudoscientific have claimed that the ley lines and their
intersection points resonate a special psychic or magical energy. These
theories often include elements such as geomancy, dowsing or UFOs. Some
similar believe these points on lines have electrical or magnetic forces
associated with them.
-
Skeptical: Skeptics of the
actuality of ley lines often classify them as pseudoscience. Such skeptics
tend to doubt that ley lines were planned or made by ancient cultures, and
argue that apparent ley lines can be readily explained without resorting to
extraordinary or pseudoscientific ideas.
Continued
(wikipedia)
BLACK LINES
Black lines seem to be naturally generated,
although quite how is not known. They may be localised and do not form a network
in the same way as Hartmann and Curry lines. This could be similar in nature to
the "sha", or deadly energy lines of Chinese Feng-Shui. They can be curved,
straight, at ground level or higher, even found in the upper levels of
buildings. There have been described 2 types of Black lines, one as "black and
depressed", the other as "shiny, black, hard and sharp." They could possibly
represent the flow lines of a negative type of "orgone-type" energy as described
by Wilhelm Reich.
(wikipedia)
HARTMANN NET/LINES
The Hartmann net consists of naturally
occurring charged lines, running North-South and East-West. It is named after
Dr. Ernst Hartmann, a well regarded German medical doctor, who first described
it soon after the second world war. Alternate lines are usually positively and
negatively charged, so where the lines intersect it is possible to have double
positive charges and double negative charges, or one positive and one negative
charge. It is the intersections that are seen to be a source of potential
problems.
The Hartmann Net appears as a structure of
radiations rising vertically from the ground like invisible, radioactive walls,
each 21 centimetres (9 inches) wide. The grid is magnetically orientated, from
North to South they are encountered at intervals of 2 metres (6 feet 6 inches),
while from East to West they are 2.5 metres (8 feet) apart. Between these
geometric lines lies a neutral zone, an unperturbed micro-climate. This network
penetrates everywhere, whether over open ground or through dwellings.
The Hartmann net has been defined using the
Chinese terms of Yin and Yang. The Yin (North-South lines) is a cold energy
which acts slowly, corresponds to winter, is related to cramps, humidity and all
forms of rheumatism. The Yang (East-West lines) is a hot, dry rapidly acting
energy. It is related to fire and is linked to inflammations.
The points formed by the intersection of
these lines, whether positive or negative, are dynamic environments sensitive to
the rhythms of the hours and the seasons.
It has been suggested that both the Curry
grids and Hartmann Net are earthing grids for cosmic rays that constantly
bombard the Earth, and that they can be distorted by other things, such as
geological fault lines and underground mining. It is also possible to have spots
where the Curry and Hartmann lines cross, causing further potential problems.
These spots are generally seen to be more detrimental than a single crossing
within the Curry or Hartmann system.
(wikipedia)
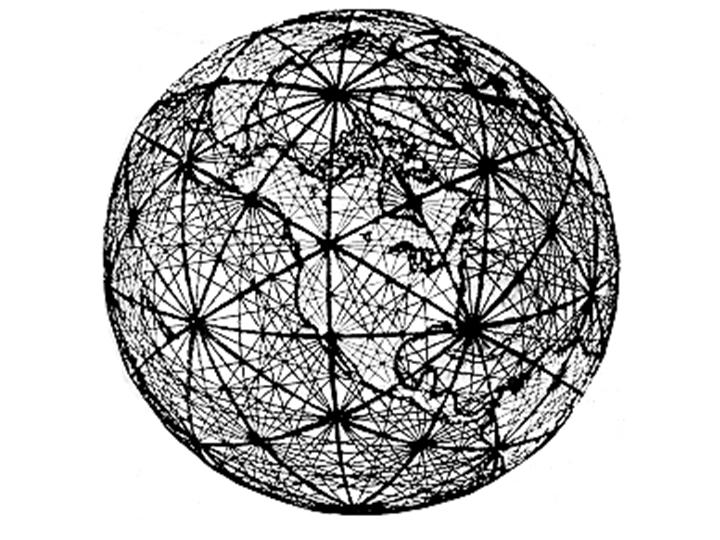
RUSSIAN
SCIENCE
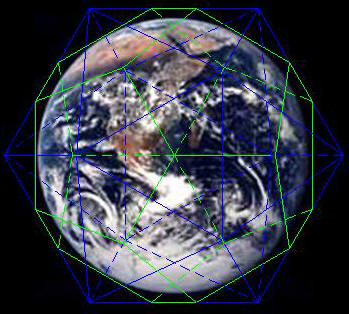
Earth crystalline energy grid
Soviet (1960's) illustration of Crystalline Planet as appeared in the Khimiya
i Zhizn, popular science journal journal of the USSR Academy of Sciences.
The Russians referred to earth grid as a 'matrix of cosmic energy' that existed
as the subtle structural (metaphysical) foundation of the Earth prior to its
creation. According to a later Russian journal, Komsomol's Pravda, the
primordial earth was initially a crystal that rounded out to a spheroid form
later.
The
Russian hypothetical model of the crystal planet, or consciousness of earth [sim.Gk.:
Gaia], is visualized as a dodecahedron (12 pentagons) superimposed with
an icosahedron (20 triangles)[sim.Gk.: Platonic solids; polyhedra; Hindu:
"mother of form" (Prakriti) swims in the "cosmic ocean" (Purusha)],
which correlate with ancient sacred sites, earth faults, magnetic anomalies,
migration patterns, etc.
Computer model of Carbon (C60)
molecule
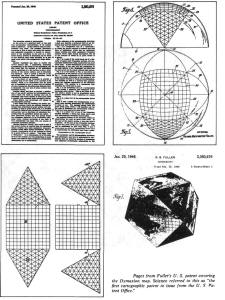
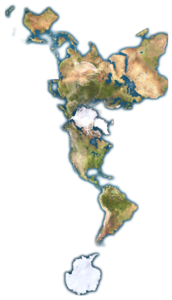
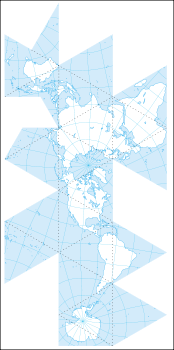
R. BUCKMINSTER FULLER: Dymaxion Map
The
Dymaxion map
of the
Earth
is a
projection
of a
global map
onto the surface of a
polyhedron,
which can then be unfolded to a
net
in many different ways and flattened to form a two-dimensional map which retains
most of the relative proportional integrity of the globe map. It was created by
Buckminster Fuller,
and patented by him in 1946, the patent application showing a projection onto a
cuboctahedron
(ie.vector equilibrium; dymaxion map). The 1954 version published by Fuller
under the title The Air Ocean
World Map used a slightly
modified but mostly regular
icosahedron
as the base for the projection, and this is the version most commonly referred
to today. The name
Dymaxion
was applied by Fuller to several of his inventions.
Unlike most other projections, the
Dymaxion is intended purely for representations of the entire globe. Each face
of the polyhedron is a
gnomonic projection,
so zooming in on one such face renders the Dymaxion equivalent to such a
projection.
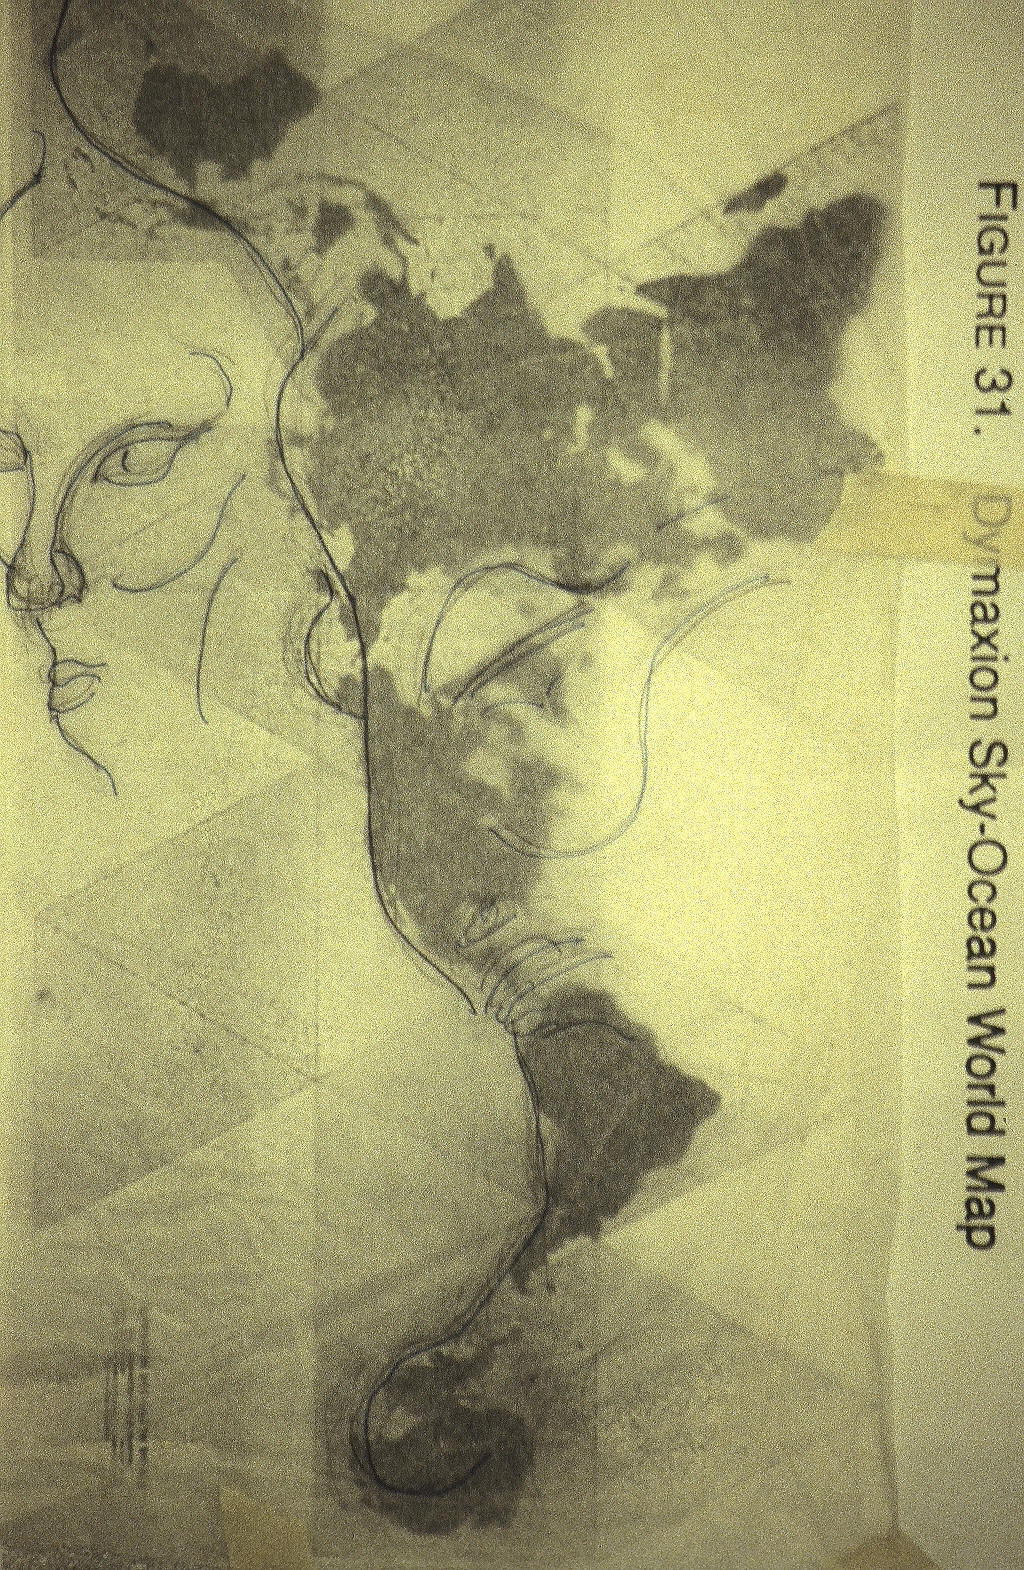
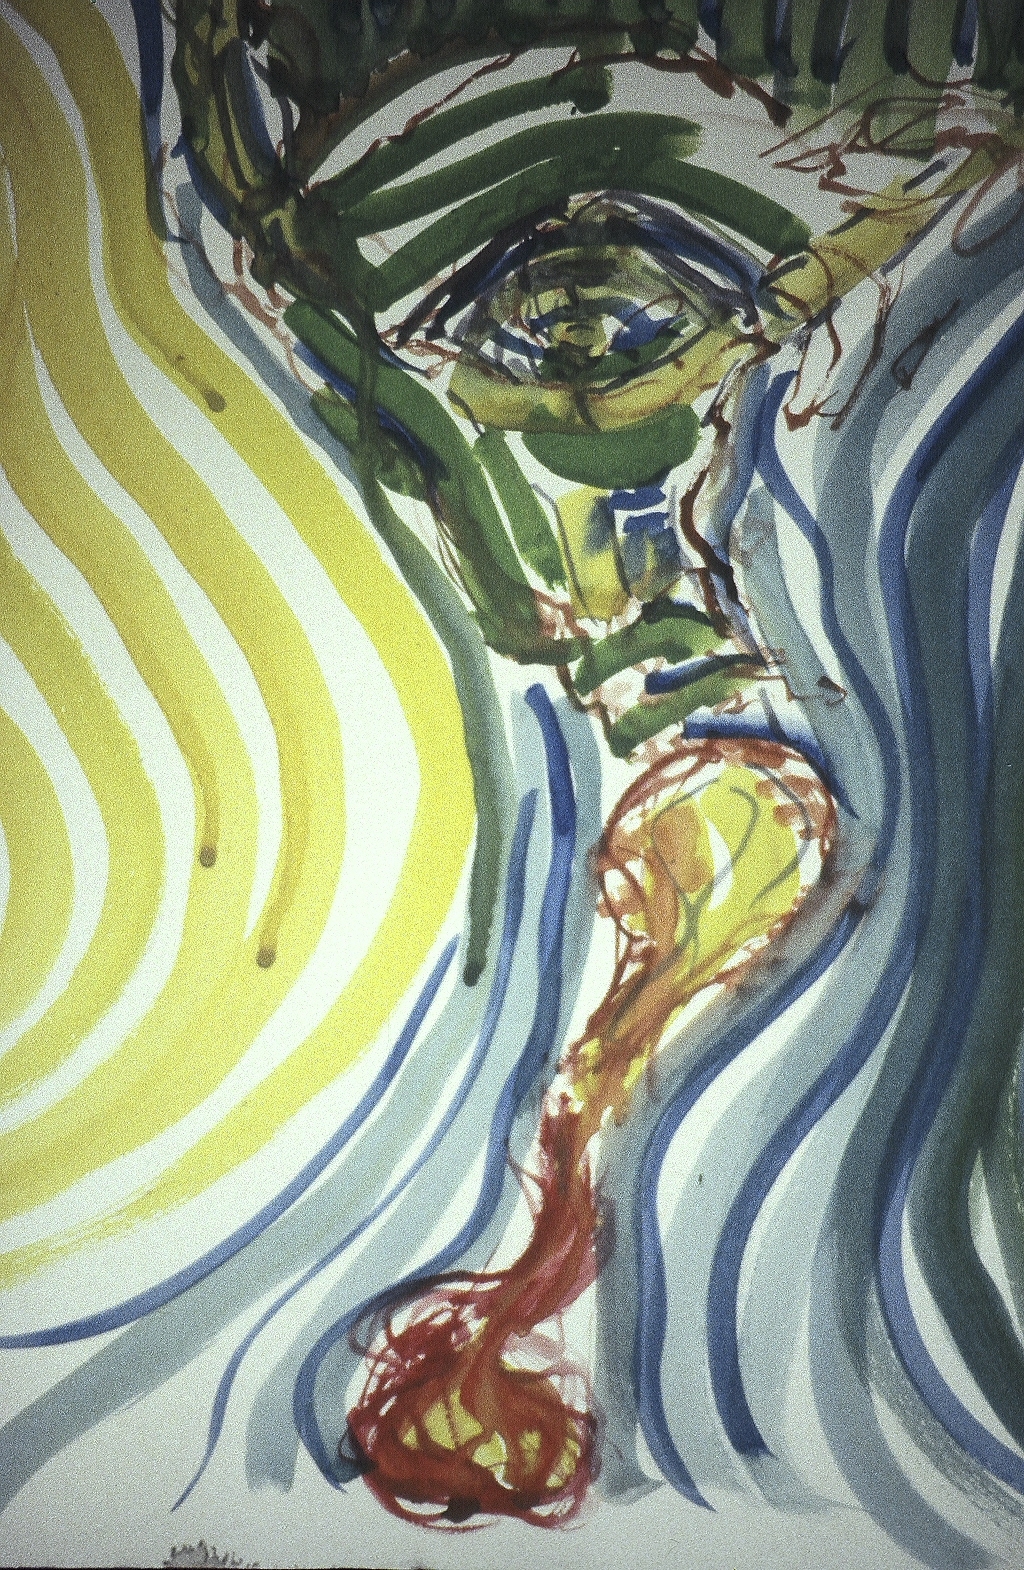
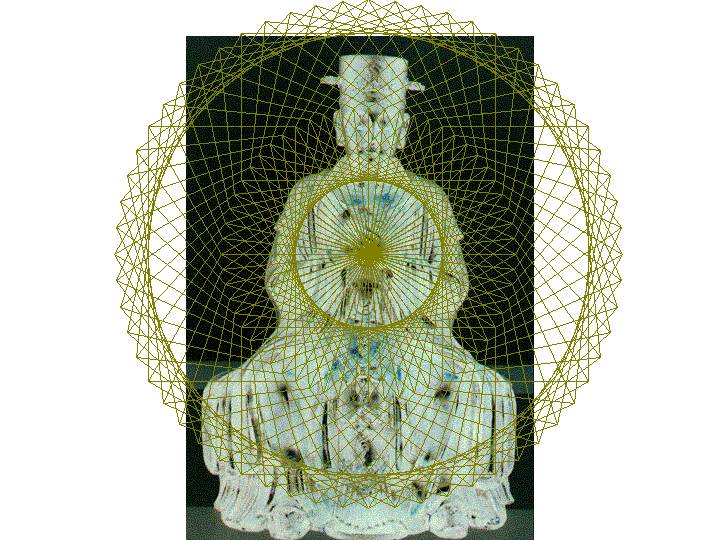
Human
face found on Earth's surface.
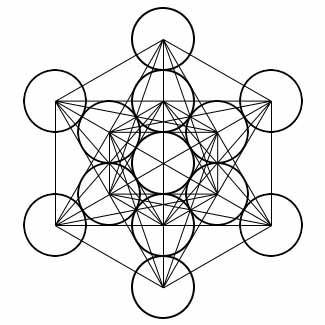
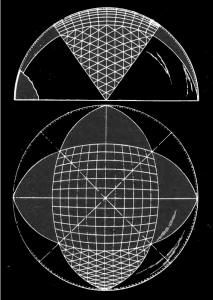
UNIFIED VECTOR GEOMETRY (UVG) 120 POLYHEDRON/SPHERE:
(Becker-Hagens) Planetary Meta-Physics
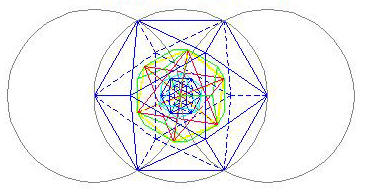
The Unified Vector Geometry (UVG) 120 Polyhedron consists of the
combination/superimposition of an icosahedron and a dodecahedron (actually
combines all elemental polyhedra), a structure of consciousness which
theoretically existed prior to the physical earth, provides a form composed
of
15 Great Circles
which intersect at
62 predicted common points,
or Major Grid Points (see below).
The form has also been referred to as the calcis rhombic triacontrahedron (30
diamond-faced polyhedron) and/or hexakis icosahedron [aka. Earth Star].
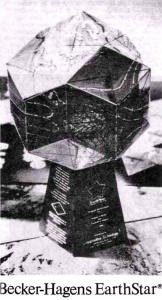
The UVG 120 Polyhedron/Sphere is so named for its
120 triangular faces, a form which was known
to ancient civilizations (eg.Greeks), was applied in two forms:
1)
Girded Sphere (marked stone): used for mapping, dowsing, geometry (earth
measure)
2)
Armillary Sphere (celestial basket): used as astronomical clock (measuring
time via the solstices and daily sunrises); the armillary sphere casts a
shadow on the internal stone sphere within its framework to demark lines,
echoing the ancient analogy, "as above, so below."
After all the elemental polyhedra are mapped on the internal stone sphere,
121 Great Circles and
4862 points are developed (essentially UVG 120;
RBF).
R.B.Fuller spent most of his life developing models and theory of synergetic
geometry (eg. vector equilibrium/cuboctahedron, rhombic-triacontahedron) and "nature's comprehensive building system,"
(later becoming UVG 120 Polyhedron
of Becker-Hagens: expanding/combining the "incomplete" Russian dodecahedron geodesic sphere
with Sanderson's icosahedron to resemble the Neolithic calcis model).
RBF showed that the "predictable physical pattern" was
also inherent in the skin layers of a balloon (through micro-photography).
In near ideal conditions, the interior gas molecules ricocheted of the inner
surface of the balloon, manifesting their kinetic energy in "great circle"
patterns of "shortest distance" frequency. The ambient temperature of the
balloon's exterior can be balanced/regulated so that the synergetic geometry
could
be visible [sim.vibrating cosmic dust particles and gases of the primordial
solar system in transit through energy vectors inherent to planetary grids;
Canopy Theory (Vail/Cyr): in prehistoric antiquity, the world climate may
have been more balanced, and therefore grid energy manifestations more
visible and more available for applications; the pattern relationships
between ancient sites and the synergetic geometry of Earth grid energy (eg.UVG 120 Polyhedron; Earth Star
of Becker-Hagens) in prehistoric
antiquity (megalithic period); the primary purpose megalithic astronomy (the
precise calculations of solar and lunar phases; solstice/equinox) was to
predict "pulses" of energy through the grid at different times of the year,
hence the establishment of holidays].
Basic Triangle of the UVG 120 Polyhedron: (Basic UVG Triangle)
(Becker-Hagens)
The 15 Major Great Circles and 62 Major Grid
Points of the UVG 120 Polyhedron define 120 Basic UVG Triangles (30°-60°-90°
degree angles), which consist of 16 lines and 45 intersection points, deriving a
global total of 106 minor great circles and 4800 (actual- 4862) minor grid
points. The side dimensions of the Basic UVG Triangle measures: 1400, 2200, and 2600
miles, respectively (totaling 6200 miles).
Archeoastronomy and Map Research:
-
Donald Cyr and Sir J. Norman Lockyer:
investigating ancient stone circles with radiating lines at specific angles
(ie.22°+,
11°+,
46°+,
90°,
120°,
180°)
from the center, aligning with other radial prominent sacred stones;
theorizes the intelligent design of nature (nature is not natural)
-
Richard J. Benson (Pythagorean
Brotherhood): direct relationship with "hidden halos" radiating out from
Great Pyramids and Sphinx (Cairo) through other prominent holy sites at
specific angles (ie.22°)
and atmospheric events (supposedly common to ancient humanity)
-
Piri Reis Map (c.1523 CE): found in
Istanbul (1929); believed to have been a copy of an ancient Greek (ancient
Alexandria) original; show "wind-rose" lines (ie.22°+,
11°+),
converging on Cairo from points in the Atlantic
-
Bauche Map (c.1737 CE): also believed to
have been a copy of an ancient Greek map; shows accurate and unique views of
Antarctica (Grid Point 62) without its ice cover, even though instruments to
detect such land masses were not invented until 1958.
Bauche
Map of 1737 shows Antarctica without ice cover.
see also:
http://www.forbiddenknowledgetv.com/videos/atlantis--lemuria/graham-hancock-beyond-atlantis-secret-advanced-technology.html
-
Mythical Maps of Mu and Pan (Lemuria)
[pre-Atlantis (3rd Root Race)]: described by the channeled Oahspe, A New
Bible in the Worlds of Jehovih in the writings of Sir James Churchward;
and in the revelations of the Lemurian Brotherhood to the Lemurian
Fellowship (Ramona, CA); were all made before the cartography of Marie Tharp
and Bruce Heezen
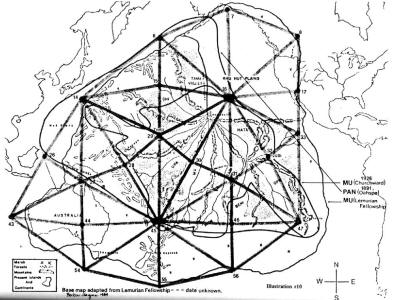
Mythical map of Lemuria
-
Ivan Sanderson (1960's): investigating
mysterious continuing disappearances and time-warp phenomena (eg.Bermuda
Triangle, Devil's Sea); theorized that tremendous hot and cold currents
crossing these most active zones caused the electromagnetic gymnastics
affecting instruments and vehicles
-
The Book of Knowledge: The Keys of
Enoch by J.J. Hurtak (1977): document of linguistic-cybernetic
information proposing artificial (above) and natural (below) time-warp areas
used by the Brotherhood; evidence of paraphysical grid line connections
among American pyramids
-
Christopher Bird: dowser; coined the term,
"Planetary Grid" in the article appearing in the New Age Journal
(May, 1975), which illuminated research involving earth/human origins and
grids, taking off parallel to and as a result of Sanderson's work; he wrote
of three Russian researchers (Nikolai Goncharov, Muscovite historian;
Vyacheslav Morozov, a construction engineer; Valery Makarov, electronics
specialist) who published an article, "Is the Earth a Large Crystal?";
supporting and following Sanderson's work; outlining Sanderson's 12 grid
points and added 50 more (62 total) [sim.icosa-dodecahedron grid; UVG 120
Polyhedron; Earth Star]
-
New Zealand's Captain Bruce Cathie: adopts
cuboctahedron grid [sim.vector equilibrium (VE) of RBF] to map UFO-grid
phenomena
-
Athelstan Spilhaus: investigates faults,
seismic activity, and continental drift
-
A.M. Davie: investigates coincidental
events
-
Michael Helus: developing theory of
harmonics called, "Astrosonics," which is a practical health technology for
people to tune in to Earth consciousness (Gaia) by reactivating the
cosmic time and place of their birth
-
John Sinkiewicz: theorizes that nature is
the result of intelligent design (nor natural) (eg.natural disasters, pole
shifts and wobbles); believes that earth energy grid is out of alignment, no
longer anchored to the north/south poles, and people are beginning to
rediscover the location of the new grid and build new sacred sites in order
to reactivate it
-
Ray Stoner: investigating American ancient
sites (pyramids) and their earth grid function
-
Terry Ross: former president of the
American Society of Dowsers, who practices dowsing in Third World countries
to manifest abundance
-
Chinese Geomancy (Feng Shui):
understanding the flow of ley lines (dragon lines) in the landscape;
balancing cosmic energy (heaven) with the flow of underground water (earth);
harmonizing buildings and their functions to heaven and earth
-
American Dowsers (Tom Bearden, Ken
MacNeill, Toby Grotz, Walter Baumgartner): pushing politics of grid research
into the development of practical "free energy devices" that will be
decentralized, affordable, and supportive of personal freedom
BECKER-HAGENS GRID MAP
The husband-and-wife team of Becker and
Hagens - created the map below. Becker is a Professor of Industrial Design at
the University of Illinois, Chicago, and Bethe Hagens is a Professor of
Anthropology at Governors State University.
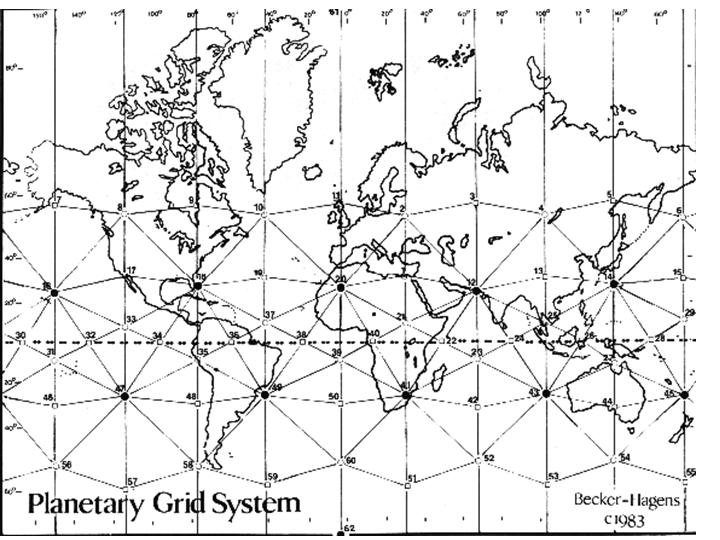
The Becker-Hagens grid cracked the
code of the Platonic Solids' positions on Earth.
Becker and Hagens show us how these two
shapes were first discovered, and then how they worked into the ultimate Earth
Grid, which they called the Unified Vector Geometry 120 Polyhedron (including
all elemental polyhedra), or the UVG
120 Earth Star, the growing/evolving conscious geomagnetic structure which
ancient people used for integrative purposes (according to Sinkiewitz,
considered the rediscovered ancient grid; Pythagorean Grid).
They ascribe this discovery to the work of
Ivan P. Sanderson, who was the first to make a case for the structure of the
icosahedron at work in the Earth. He did this by locating what he referred to as
vile vortices, or areas of the Earth where mysterious disappearances,
mechanical failures and time-space distortions were seen to occur.
These 3 scientists worked off of their
combined talents to determine this "matrix of cosmic energy" that encircles the
Earth. With this new formulation of the Global Grid, Becker and Hagens write :
These new lines and points, in conjunction
with Sanderson's (esp.vile
vortices), indicated some
interesting correlations:
Gravitational anomalies:
(eg.unexplained phenomena)
Volcanoes:
lithospheric plate lines where volcanic activity occurs (eg.Hawaii; Canary
Is.)
Electro-Magnetic Anomolies:
platonic polyhedra vertices (eg.generative jitterbug)
Meteorology:
worldwide atmospheric highs and lows;
centers of cyclones and anti-cyclones which give birth to hurricanes which
follow grid lines; as do wind and water currents (eg.Katrina; red spot of
Jupiter)
Earth Faults: Earth's seismic fracture zones and
ocean ridge lines (eg.mid-Atlantic ridge GP10-37; latitudinal ridge line 17,
18, 20- Silk Road)
Solar Radiation:
maximum amounts (GP1, 17, 41)
Atomic Explosion: 1700 million years
ago there was a spontaneous reaction (U-235) (GP40)
Mineral Ores: continental plate
intersections (oil deposits; eg.Tyumen GP3; oil speculation)
Soil: lack of certain elements has
lead to unique plant life (Keg.iev GP2, Lake Baikal GP4; humanoid giants
under water breathing and sunken cities)
Migratory animals:
(eg. winter bird migrations, GP12, 20, 41)
Ancient
megalithic civilizations:
Giza (GP1), Harrapa (GP12), Stonehenge (GP11), Peru(GP45), Easter Is.
(GP47), northern Mongolia (GP4)
Becker and Hagens' attention was drawn to
this research through the work of Chris Bird, who wrote his article on the
"Planetary Grid" in the New Age Journal of May 1975. They were so overwhelmed
with this new information that they eventually set up a meeting with him to
discuss the work. Soon after this, they "completed" the Grid, making it
compatible with all the Platonic Solids, by inserting a creation from
Buckminster Fuller's work. Quote from their work...
We propose that the planetary grid map
outlined by the Russian team Goncharov, Morozov and Makarov is essentially
correct, with its overall organization anchored to the north and south axial
poles and the Great Pyramid at Giza. The Russian map, however, lacks
completeness, in our opinion, which can be accomplished by the overlaying of
a complex, icosahedrally-derived, spherical polyhedron developed by R.
Buckminster Fuller. In his book Synergetics 2, he called it the
"Composite of Primary and Secondary Icosahedron Great Circle Sets." We have
shortened that to Unified Vector Geometry (UVG) 120 spheres. We use the
number 120 due to its easy comprehension as a spherical polyhedron with 120
identical triangles - all approximately 30, 60 and 90 in composition.
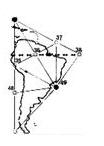
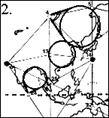
South America's grid triangle forms
the continent around itself. In looking at the southernmost tip of South
America, you can see how the force of node number 58 pushes the land away
from its due south trend and towards the east. Then, if you look at node 49,
on the middle of the East Coast of South America near Rio de Janeiro, you
can clearly see how the force of the node has pushed the landmass of the
continent into a rounded shape.
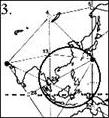
Looking at Australia, you can
clearly see that the whole continent, and especially the northwest side,
forms very precisely within the stretching forces of this area of the Global
Grid. Here, if we look to the exact north and middle of Australia on point
27, we see a circular "node point" displacing the land around it and forming
the Gulf of Carpenteria. Again, the nodes themselves have shaped the land
into circular "vortices," repelling the continental mass from themselves and
in this case, also shaping the outline of the island directly above
Australia.
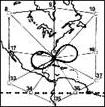
Node 44 is precisely aligned with
the bottom of Antarctica, and we see either edge "drooping" to the right or
the left from this. According to Richard Lefors Clark, this is the "bowtie"
energetic configuration showing itself in the Australian landmass, which he
calls a "diamagnetic energy vortex." We will examine how such a shape could
be formed by the curved, spiraling energies that make up the grid below.
Clark also shows us that the Gulf of Mexico follows this same curving
energetic organization, as well as the two coastlines of the continental
United States.
Africa shows the combined action of
two larger triangles, one with the point facing downwards on the African
continent and its neighbor pointing upwards, connecting the Indian Sea.
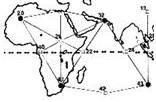
The downward-pointing triangle
certainly describes Africa well, and the extra land on the western side can
be explained by the pressure coming from the Mid-Atlantic Ridge, which is
almost precisely the same as the Atlantic grid line formed by points 10, 19,
37, 38, 39 and 50. The east coast of Africa and Saudi Arabia follow the
eastern side of the triangle very nicely, on the grid line from point 41 to
point 12.
Node point 22 gently pushes in on
Africa's east coast, causing it to dip inwards as it travels and forming the
Somalia Basin. We can also assume that the "cracks" separating Africa and
Saudi Arabia were caused by the expansion of the Grid, forcefully pulling
the land into alignment. The "crack" to the immediate left of point 12
follows the grid line exactly. And finally, the upward-pointing triangle can
be clearly seen to cut its way right into the land, with Africa's coast
defining its left side and India's coast defining its right.
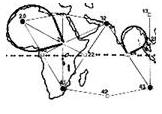
In this next illustration, we can
see how point 21, in the center of the African continent, works with its
above-right partner point 20 in providing a framework for the bow-shaped
energy vortex that shaped the northeast coast of Africa.
Point 20 is the only "vile vortex"
that is significantly inland; 41, near South Africa, and 42, near India, are
the only others that touch land at all! This is probably due to the
incredible strength that they possess, which seems to repel landmasses. We
can see how the northwest coast of Africa is indeed very circular, and point
20 is directly at the center of this "bowtie" of energy.
We see Dr. Leflors Clark's bow-shaped
"diamagnetic energy vortex" shaping the land in a smooth curve. We can also
see the same curving formation created by the east coast of India and the
west coast of Southeast Asia. This vortex is balanced between points 24 and
13. We remind ourselves that these smooth curves illustrate the spiraling
nature of the superstrings that make up these geometric energy fields, here
expressed as spiraling lines of magnetic force.
According to Dr. Clark, the point at
the center of the "bowtie" becomes a magnetic null zone of zero gravity when
appropriately triggered by the right geometric positions of the Sun, Moon
and Planets to the Earth. In those moments of conjunction, there is a
"hyper-dimensional bleed-through," and we then get time dilations.
The next three pictures, showing the
circular grid energy formations surrounding the east coast of China and
surrounding area:
In picture number 1, we have our
straight grid map of China for comparison. Picture 2 has three circular
vortexes in it. We have already discussed the bottom left vortex in India
and China. Then, the center vortex shapes the East coast of China, based off
of and emanating from point 13. The uppermost and largest vortex in Picture
2 shapes the entire Japanese and Russian archipelago, and is centered in and
emanating from point 4.
In picture number 3 we have a vortex
centered in Sanderson's "vile vortex" near Japan, the "Devil's Sea," here
listed as point 14. This vortex is "equalized" by points 25 and 26, both of
which are equidistant from the edge of the circle. And obviously, Indonesia
precisely traces the bottom left of the circle itself. This is obviously a
very strong vortex to be able to shape the land of Indonesia from where it
stands, according to Becker and Hagens.
Another area of continuing
disappearances and mysterious time-warps is the Devil's Sea located east of
Japan between Iwo Jima and Marcus Island. Here events have become so
sinister that the Japanese government has officially designated the area a
danger zone. This area was significant enough to the work of Bermuda
Triangle author Charles Berlitz that he wrote a whole book dedicated to it
and the "bigger picture," entitled The Devil's Triangle. It is becoming more
and more clear that our geometric shapes, expressed as the consciousness
unit expanded to a planetary scale, are far more than abstract concepts of
theoretical physics. What we have here are direct, quantifiable and
measurable phenomena, and these geometry-based Grid patterns are simply the
simplest, and therefore the best solution to the problem.
The "grid bands" on the Earth and
how their effects shaped the Ring of Fire', the flowing of the Nile River,
the "node point" of the Egyptian northern coast centered in 'Giza, and the
vertical structure of the Yucatan Peninsula. Now, with the full map of the
Becker-Hagens grid, we can see a great deal more from the effect of these
straight longitudinal lines.
By referring back to the main map,
the reader can clearly see that the entire Eastern side of Hudson Bay in
Canada precisely follows the line from 18 in Florida to 9 in the Bay to 61
at the North Pole. Furthermore, all of England is precisely within the line
created by point 20 in Africa, through point 11 in England to point 61 at
the North Pole. So, there are a variety of ways to see this energy at work
on Earth. One can begin to visualize this Grid energy as a living net of
"wires" that are tightly stretched over a thin balloon. It is obvious to us
that what we think of as randomly placed continents are actually conforming
to this massive energy, disappearances, gravity loss, levitation and other
related phenomena.
Becker-Hagens explain how these grid
points seem to attract large population centers.
Look at the South American landmass.
Not only does it fit perfectly a Grid Triangle, but we can sea circular,
bowtie-shaped energy at work in the actual shaping of the landmass itself.
This "bowtie" is nearly centered
within the diamond that is formed between points 18, 35, 37 and 49. We
already saw the African "vile vortex" shaping a similarly large "bowtie" in
the above diagrams. The offset of the South American landmass from being
precisely within this "diamond" again could be accounted for by the pushing
of the Mid-Atlantic Ridge, which follows the lines of the Global Grid with
amazing precision.
Looking back at the Becker-Hagens
map, it is quite easy for us to see how this line clearly demarcates the
separation between the continents, just as the Mid-Atlantic Ridge is the
point of expansion between the two continental plates.
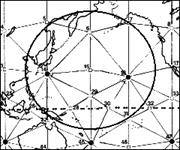
An elliptical-shaped gravity field
is clearly visible when the center is placed directly in node 15. If we use
any standard image editing program and "drag out" an ellipse using point 15
as a center, we can indeed align it precisely with the island formations to
the far west of our diagram. We can see the amazing connections of this
energy formation as soon as we start looking at the diagram. We can try
other center points besides 15, but the ellipse will not fit anywhere else
as precisely as it does right at that spot.
This massive energy vortex seems to
provide the clearest Grid counterpart for the existence of the Ring of Fire,
which is a ring of volcanoes and tectonic activity surrounding the Pacific
Ocean. When we look at this "grid ring" carefully, we can see that it
represents the perfect fusion between the Earth's landmasses and the Global
Grid. Going clockwise from the 12:00 point, the ring will perfectly touch a
"square" of grid points, as 7, 31, 27 and 5. (Node point 27, near Australia,
is the only one that isn't touched exactly.
We can also see that this ellipse is
well defined by points 14 and 16, again Sanderson's incredibly powerful
"vile vortices," the points of the icosahedron. We have already seen how the
incredible gravitational force of these "vortices" was able to shape the
entire upper Western half of Africa into an elegant, circular shape. Now, we
are seeing two of these vortices working together to form an even larger
shape. The ring forms part of the East Coast of China, as well as a good
part of the upper Russian coastline surrounding node 5. It also defines part
of the southern coastline of Alaska.
The grid points 14 and 16 would be
akin to the two poles of the dividing cell. The grid lines provide us with a
simplified depiction of the "spindle fibers" that form in cell mitosis. The
actual ring of energy that is created forms a precise analog of the nuclear
membrane of the cell, as it continues its expanding, elliptical process of
division.
EARTH GRID VORTICES (1-62):
B
= BALANCED
C
= COLD/YIN
H
= HOT/YANG
MRP = Magnetic Reversal Point
VV
= Vile Vortice
|
PLANETARY GRID SYSTEM |
|
GRID POINT NO. |
ENERGETIC QUALITY |
LOCATION DESCRIPTION |
LATITUDE |
LONGITUDE |
|
1 |
B; MRP |
AFRICA:
Egypt,
Giza;
delta of
Nile
r. |
31.72°N |
31.20°E |
|
2 |
H |
EUROPE:
Russia,
Kiev;
ancient Viking crossroads |
52.62°N |
31.20°E |
|
3 |
B |
EURASIA:
Central Russia;
peak
of
Ural
m.; source of the
Irtysh
r. and
Ob
r.; near Serov |
58.28°N |
67.20°E |
|
4 |
H |
ASIA:
Mongolia-Russia; Altay m., near Kyzyl;
Lake
Baikal;
source of the Yenisey and
Angara
r., near Tulun |
52.62°N |
103.20°E |
|
5 |
B |
ASIA:
Russia;
Stanovoy Khrebet; source of the
Aldan
and
Lena;
Sea
of
Okhotsk |
58.28°N |
139.20°E |
|
6 |
H |
NORTH PACIFIC:
Bearing
Sea;
N tip of
Aleutian Islands;
Tutu. Is.; Komandorskiye Ostrovo (Commander Is.); near
dateline |
58.62°N
|
175.20°E
|
|
7 |
B |
NORTH AMERICA:
Gulf of Alaska;
Alaska Range,
McKinley mt. |
58.28°N |
148.80°W |
|
8 |
H |
NORTH AMERICA:
Canada,
Alberta;
Rocky m., Robson mt. |
52.62°N |
112.80°W |
|
9 |
B |
NORTH AMERICA:
Hudson Bay,
Belcher i. |
58.28°N |
76.80°W |
|
10 |
H |
NORTH ATLANTIC:
near tip of
Greenland |
52.62°N |
40.80°W |
|
11 |
B |
EUROPE:
England,
Scotland
(nr.Stonehenge) |
58.28°N |
4.80°W |
|
12 |
C; MRP; VV |
ASIA:
Persia
(Pakistan),
Indus
r.;
Persepolis;
Karachi |
26.57°N |
67.20°E |
|
13 |
B; MRP |
ASIA:
China,
near Xian;
Himalayas,
Kunlun
m. |
31.72°N |
103.20°E |
|
14 |
C; MRP; VV |
ASIA:
Japan,
the "Devil's Sea" (Iwo
Jima) |
26.57°N |
139.20°E |
|
15 |
B; MRP |
PACIFIC: below Emperor Seamounts; Midway i. |
31.72°N |
175.20°E |
|
16 |
C; MRP; VV |
PACIFIC:
Hawaii;
Big
Island,
Moana Loa (Puu'o'ou);
Maui,
Haleakala |
26.57°N |
148.80°W |
|
17 |
B; MRP |
NORTH AMERICA:
Mexico,
Baja California;
near
Ensenada
and
Yuma |
31.72°N |
112.80°W |
|
18 |
C; MRP; VV |
NORTH AMERICA:
Florida
coast; near
Miami,
West Palm Beach
(Cape
Canaveral),
Bahamas |
26.57°N |
76.80°W |
|
19 |
B; MRP |
MID-ATLANTIC NORTH: Mid-Atlantic ridge |
31.72°N |
40.80°W |
|
20 |
C; MRP; VV |
AFRICA:
Tropic of Cancer;
Algeria,
In Salah; near Tahat m. |
26.57°N |
4.80°W |
|
21 |
H |
AFRICA:
Ethiopia-Sudan; near Gonder; near Tana l. and
Blue Nile
r. |
10.81°N |
31.20°E |
|
22 |
B |
EQUATOR:
AFRICA:
Somalia
Basin;
Intertropical Convergence Zone; near Carlsberg Ridge |
0° |
49.20°E |
|
23 |
H |
INDIAN OCEAN:
Mid-Indian Ridge; Chagros Archipelago |
10.81°S |
67.20°E |
|
24 |
B |
EQUATOR:
INDIAN OCEAN
(Ceylon/Sri Lanka) |
0° |
85.20°E |
|
25 |
H |
ASIA:
Gulf
of
Thailand;
Cambodia;
Angkor
Wat |
10.81°N |
103.20°E |
|
26 |
B |
EQUATOR:
ASIA:
Indonesia,
Sulawesi;
Celebes
i., near Palu |
0° |
121.20°E |
|
27 |
H |
AUSTRALIA:
Gulf
of
Carpenteria |
10.81°S |
139.20°E |
|
28 |
B |
EQUATOR: MID-PACIFIC: Solomon is.; near Equatorial counter
current |
0° |
157.20°E |
|
29 |
H |
MID-PACIFIC:
Marshall
is. |
10.81°N |
175.20°E |
|
30 |
B |
EQUATOR: MID-PACIFIC;
Polynesia,
Kiribati;
between Line is., Kiritimati (Christmas) i. and
Phoenix
is.,; near Jarvis i. |
0° |
166.80°W |
|
31 |
H |
MID-PACIFIC:
French Polynesia,
Tuamotu Archipelago;
near Motu One i., Caroline is. |
10.81°S |
148.80°W |
|
32 |
B |
EQUATOR: MIDSOUTH-PACIFIC; Intertropical Convergence Zone;
above Marquesas is. |
0° |
130.80°W |
|
33 |
H |
MID-PACIFIC: East Pacific Rise; Clipperton is. |
10.81°N |
112.80°W |
|
34 |
B |
EQUATOR: MID-PACIFIC; East Pacific Rise; Galapagos is. |
0° |
94.80°W |
|
35 |
H |
SOUTH AMERICA:
Peru;
Andes;
near Nevado Huascaran |
10.81°S |
76.80°W |
|
36 |
B |
EQUATOR:
SOUTH AMERICA:
Brazil;
near Novo Paraiso; Amazon r. |
0° |
58.80°W |
|
37 |
H |
MID-ATLANTIC: mid-Atlantic ridge;
Guiana
Basin |
10.81°N |
40.80°W |
|
38 |
B |
EQUATOR: MID-ATLANTIC; Intertropical Convergence Zone;
Romanche Gap; near St.Peter and St.Paul Rocks |
0° |
22.80°W |
|
39 |
H |
MID-ATLANTIC:
Angola
Basin;
Ascension i., near St.Helena i. |
10.81°S |
4.80°W |
|
40 |
B |
EQUATOR:
AFRICA:
Gabon;
near Mokokou |
0° |
13.20°E |
|
41 |
C; MRP; VV |
AFRICA:
South Africa,
Zimbabwe;
near Gweru |
26.57°S |
31.20°E |
|
42 |
B; MRP |
INDIAN OCEAN:
Southwest Indian Ridge |
31.72°S |
67.20°E |
|
43 |
C; MRP; VV |
INDIAN OCEAN:
Wharton
Basin |
26.57°S |
103.20°E |
|
44 |
B; MRP |
AUSTRALIA
(SOUTH): near Torens l.; near Whyalla |
31.72°S |
139.20°E |
|
45 |
C; MRP; VV |
SOUTH PACIFIC: Loyalty is.;
Fiji |
26.57°S |
175.20°E |
|
46 |
B; MRP |
SOUTH PACIFIC:
Southwest
Pacific
Basin |
31.72°S |
148.80°W |
|
47 |
C; MRP; VV |
SOUTH PACIFIC: East Pacific Rise; Tropic of Capricorn;
Easter i. |
26.57°S |
112.80°W |
|
48 |
B; MRP |
SOUTH PACIFIC:
Peru
Chile
Trench; Nazcar Ridge |
31.72°S |
76.80°E |
|
49 |
C; MRP; VV |
SOUTH AMERICA:
Brazil
coat;
Rio de Janeiro,
near
Sao Paulo |
26.57°S |
40.80°W |
|
50 |
B; MRP |
SOUTH ATLANTIC:
Angola
Basin;
near Walvis Ridge |
31.72°S |
4.80°W |
|
51 |
B |
SOUTH ATLANTIC:
Atlantic-Indian
Basin |
58.28°S |
31.20°E |
|
52 |
H |
SOUTH INDIAN: Kerguelen Plateau; McDonald is.; Kerguelen is. |
52.62°S |
67.20°E |
|
53 |
B |
SOUTH INDIAN:
South
Indian
Basin |
58.28°S |
103.20°E |
|
54 |
H |
SOUTH INDIAN: Southeast Indian Ridge; Kangaroo Fracture |
52.62°S |
139.20°E |
|
55 |
B |
SOUTH PACIFIC: Pacific-Antarctic Ridge;
Emerald
Basin |
58.28°S |
175.20°E |
|
56 |
H |
SOUTH PACIFIC: Pacific-Antarctic Ridge; Udintsev Fracture |
52.62°S |
148.80°W |
|
57 |
B |
SOUTH PACIFIC:
Southeast
Pacific
Basin;
Albatross Cordillera |
58.28°S |
112.80°W |
|
58 |
H |
SOUTH PACIFIC:
Chile
Rise; South American tip |
52.62°S |
76.80°W |
|
59 |
B |
SOUTH ATLANTIC:
East
Scotia
Basin;
South Orkney
is. |
58.28°S |
40.80°W |
|
60 |
H |
SOUTH ATLANTIC:
South Atlantic
ridge;
Atlantic
Indian
Basin;
near Bouvet i. |
52.62°S |
4.80°W |
|
61 |
C |
NORTH POLE |
90°N |
|
|
62 |
C |
SOUTH POLE |
90°S |
|
|
Endnote: Barbara Hero predicted the future North Pole to be at Aleutian Is.,
Alaska.
Megalithic sites plotted on world grid as in
David Zink's book, The Ancient Stones Speak, concur with Planetary Grid
System of Becker and Hagens.
VILE VORTICES
The "10 Vile Vortices"
(Ivan T.
Sanderson) [sim.Becker-Hagens: "Twelve Devils' Graveyards Around the World"
(Saga Magazine, 1972)]
[Planetary
Grid Points:
-
North (even/yin-):
12, 14, 16, 18, 20 (eg.drain)
-
South (odd/yang+): 41, 43, 45, 47, 49
(eg.sink)
]
are magnetic-gravitational vortex points
(sim.20
'magnetic reversal points'), which are believed to be
dimension doors [accounting for non-arbitrariness of nuclear testing/secret
launchings (eg.Cape Canaveral, Alice Springs, Lopnor), UFO phenomena, weather
pattern generators, unexplained disappearances; eg. Bermuda Triangle,
Philadelphia Experiment
(Paradox, Nicholas Nelson)] (see 'Bloch
Wall').
Due to the energetic structure (icosahedral
triangles) of earth, the equator line (0°
LAT) has no diamagnetic field, while the actual magnetic reversal areas occur at
the Tropic of Cancer and the Tropic of Capricorn (vertex points of spinning
icosahedral triangles, occurring at approx. 30°N
LAT, 30°S
LAT, varying LONG). There are 20 'magnetic reversal points' (1, 12-20, 41-50;
sim.'vile vortices'), which alternate power position/quality according to the
celestial influence (ie.electro-magnetic spectrum) of the sun, moon, planets,
and stars, upon the gravitational spin of earth. The function of the magnetic
reversal point alternation is to maintain, bind/hold/unify, and/or balance the
Earth.
The dimension doors are believed to be
portals to parallel universes.
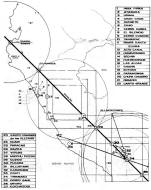
The Gaze of the Sphinx (eg.Silk
Road) essentially coincides with the top line of the Vile Vortices [5
triangular points spinning about the upper horizontal hexagon of the icosahedron,
a component of the Planetary Grid System, Earth Crystal, and Unified Vector
Geometry (UVG) 120 Polyhedron].
Current work from Bethe Hagens:
www.missionignition.net/bethe